> ## Documentation Index
> Fetch the complete documentation index at: https://docs.speedsignal.com/llms.txt
> Use this file to discover all available pages before exploring further.
# Dashboard tour
> A map of every Speed Signal AI view (Daily Brief, Signal Board, Watchlist, Alerts, and the menu) plus how to read a ticker's Phase and Conviction.
This is a map of the whole dashboard: the four main tabs across the top, the extra views tucked into the menu, and how to read any single ticker. Use it to get oriented; each view has its own page with the details.
## What you see
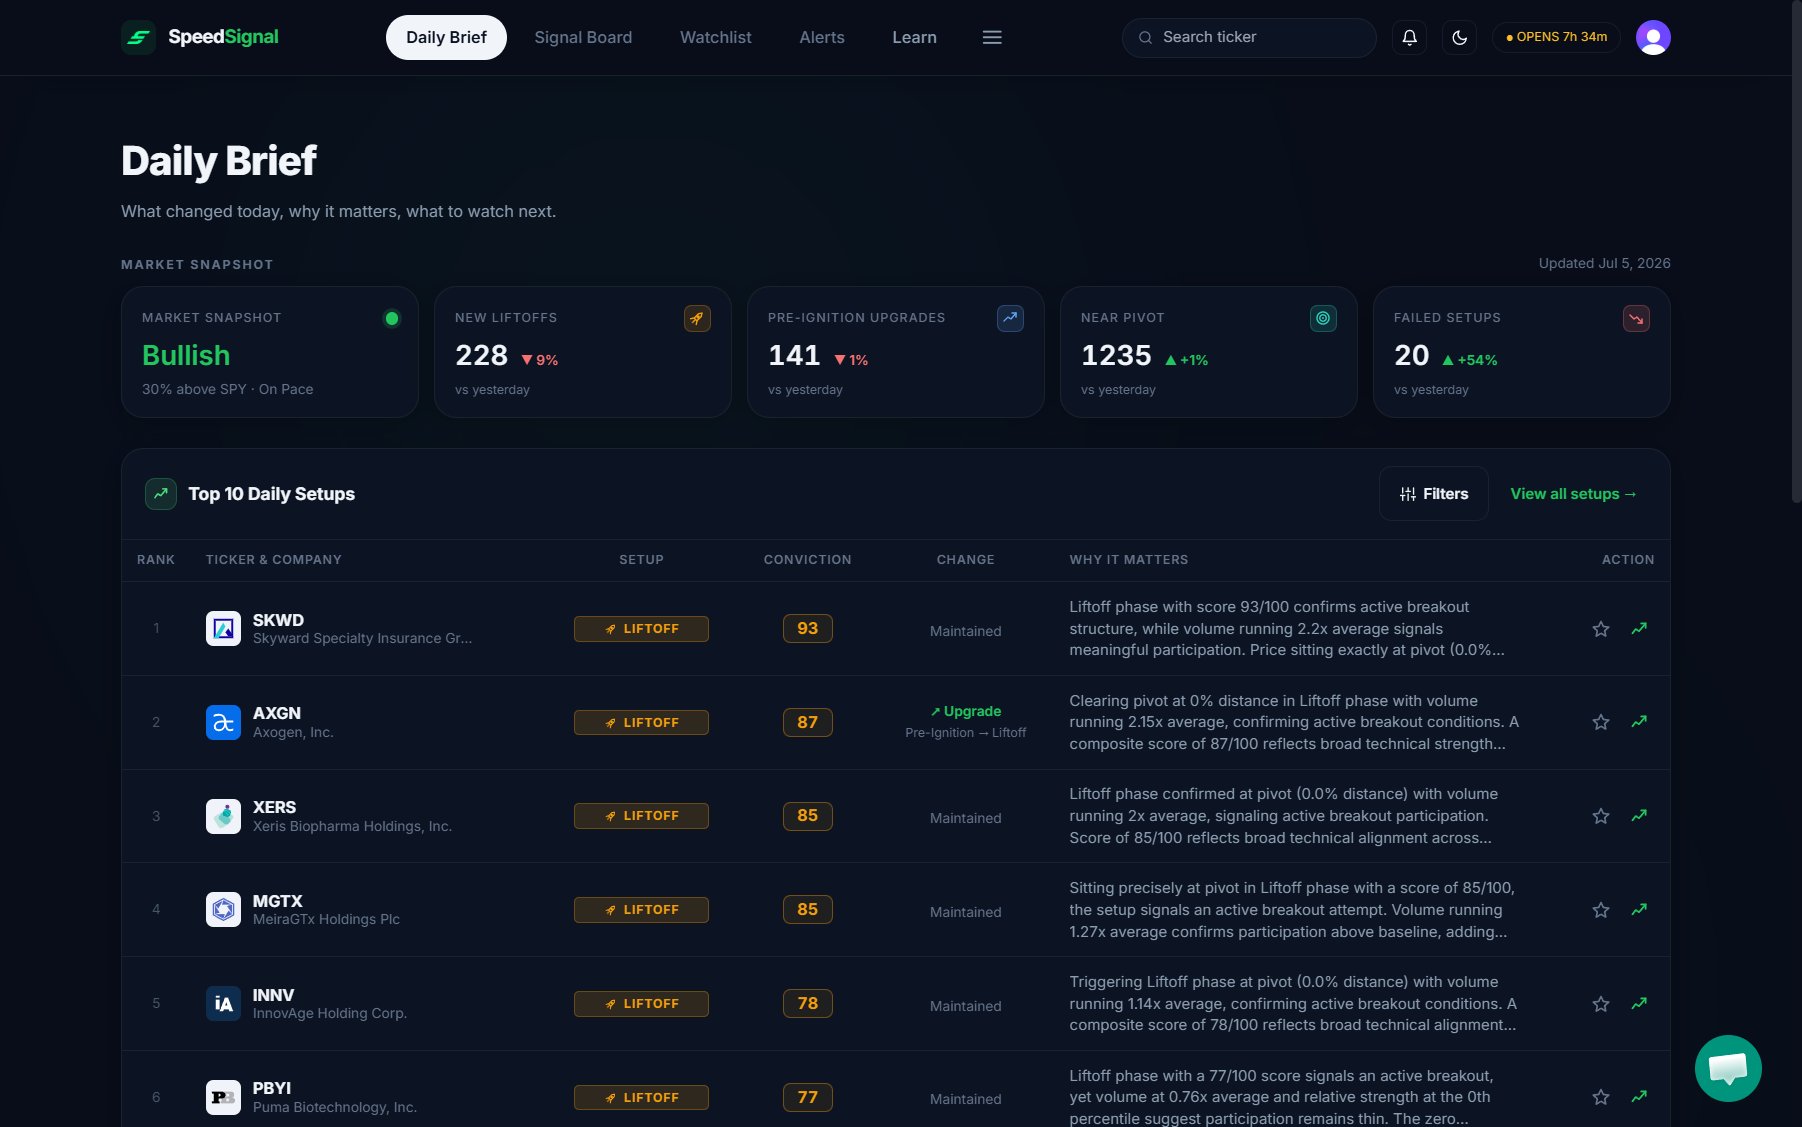
Speed Signal AI opens on the **Daily Brief**. A top navigation bar holds the four primary tabs, and a **menu** (the hamburger button) holds the rest. A **Learn** link and a **bell** icon (which jumps to Alerts) sit in the same bar.
 ## The main tabs
These four are always one tap away. On a keyboard you can jump with **1**, **2**, **3**, and **4**. Two more shortcuts help: **/** jumps to the Signal Board and focuses its search box, and **T** toggles between the dark and light themes.
* **Daily Brief**: the home view. It summarizes the latest scan with a Market Snapshot (an overall regime read plus KPIs like New Liftoffs, Pre-Ignition Upgrades, Near Pivot, and Failed Setups), a Top 10 Daily Setups table, a short Signal Story, and Sector Strength. Start here to see the day at a glance. See [Daily Brief](/dashboard/daily-brief).
* **Signal Board**: the full, filterable screener. Narrow 3,000+ tickers with quick-filter **chips** (such as New Liftoffs, Highest Conviction, Near Pivot, and Large Cap), a search box, and an **Advanced Filters** drawer (editable eligibility thresholds, status/tier/risk pills, and a compact comparison table). See [Signal Board](/dashboard/signal-board).
* **Watchlist**: the names you've saved. It starts empty; tap the **star** next to any ticker to add it, then track how its Phase and Conviction change over time. See [Watchlist](/dashboard/watchlist).
* **Alerts**: notifications you turn on. Toggle presets or build custom per-ticker rules, delivered by email, push, or in-app. It starts empty too. See [Alerts](/dashboard/alerts).
## The menu (hamburger)
The menu holds the more focused views:
* **Ticker Detail**: the full page for one ticker: chart, context, and the **Overview**, **Technicals**, and **Fundamentals** sub-tabs. You usually reach it by clicking a row anywhere in the dashboard. See [Ticker Detail](/dashboard/ticker-detail).
* **Top Movers**: the session's biggest movers, with each row's Phase shown alongside. See [Top Movers](/dashboard/top-movers).
* **Anomalies**: tickers flagged for unusual behavior outside the canonical setup (for example, a volume climax or a gap extreme). See [Anomalies](/dashboard/anomalies).
* **Overview**: a market-wide summary view. (This is different from the **Overview** sub-tab *inside* a Ticker Detail page, which is about that one ticker; see "How to read a ticker" below.)
* **Settings**: your notification preferences and data controls (export or delete your data). The theme toggle lives in the top bar, and the chart provider is chosen on a ticker's detail page, not here. See [Account & settings](/account-and-settings).
On a narrow phone, the **Alerts** tab moves into the menu so the top bar stays tidy. The views are the same; only where you tap to reach them changes, so your screen may not match a screenshot exactly.
## How to read a ticker
Open any ticker (click its row) to see its full context. Every part is descriptive, meant to help you review the situation before doing your own research:
* **Phase** describes the current state of the setup: **Coiling** (tightening base), **Pre-Ignition** (conditions starting to show), **Liftoff** (the most active phase, where the most conditions line up in the data at once), or **Below** (not in an active setup right now).
* **Conviction** groups how the ticker ranks against the rest of the market that session: **Low**, **Medium**, or **High**. On the detail page it appears as **Conviction NN/100**; in tables it sits under the **Conviction** column (shortened to **Conf** in the Advanced Filters drawer table and the Anomalies table). It's a separate axis from Phase: a Coiling ticker can be High Conviction, and a Liftoff ticker can be Low.
* **Risk flags** identify conditions worth a closer look, for example, **Extended** (already far from its base), **Elevated VIX**, **Bearish Market Regime**, or **Pre-Earnings Run** (an earnings event is near). They add context; they don't change the underlying number.
* **Chart and levels** show technical reference points (such as the pivot the setup is built around) as context, not as entry or exit instructions. The candlestick chart is the one live element on the page.
The three sub-tabs organize the rest: **Overview** (the summary for that ticker), **Technicals** (the price and volume behavior behind the Phase), and **Fundamentals** (company financials).
## Limits & common mistakes
* **Two "Overview" views exist.** The **Overview** in the menu is a market-wide summary; the **Overview** sub-tab inside Ticker Detail is about one ticker. Check which one you're on.
* **The board is end-of-day.** Only the ticker's candlestick chart is live; everything else reflects the last completed session.
* **A view organizes data; it doesn't recommend action.** Tabs, chips, and flags surface context for your own research.
## Next steps
Filters, chips, and the Advanced Filters drawer in depth.
What each phase means and why Conviction is relative.
Everything on a single ticker's page, sub-tab by sub-tab.
## The main tabs
These four are always one tap away. On a keyboard you can jump with **1**, **2**, **3**, and **4**. Two more shortcuts help: **/** jumps to the Signal Board and focuses its search box, and **T** toggles between the dark and light themes.
* **Daily Brief**: the home view. It summarizes the latest scan with a Market Snapshot (an overall regime read plus KPIs like New Liftoffs, Pre-Ignition Upgrades, Near Pivot, and Failed Setups), a Top 10 Daily Setups table, a short Signal Story, and Sector Strength. Start here to see the day at a glance. See [Daily Brief](/dashboard/daily-brief).
* **Signal Board**: the full, filterable screener. Narrow 3,000+ tickers with quick-filter **chips** (such as New Liftoffs, Highest Conviction, Near Pivot, and Large Cap), a search box, and an **Advanced Filters** drawer (editable eligibility thresholds, status/tier/risk pills, and a compact comparison table). See [Signal Board](/dashboard/signal-board).
* **Watchlist**: the names you've saved. It starts empty; tap the **star** next to any ticker to add it, then track how its Phase and Conviction change over time. See [Watchlist](/dashboard/watchlist).
* **Alerts**: notifications you turn on. Toggle presets or build custom per-ticker rules, delivered by email, push, or in-app. It starts empty too. See [Alerts](/dashboard/alerts).
## The menu (hamburger)
The menu holds the more focused views:
* **Ticker Detail**: the full page for one ticker: chart, context, and the **Overview**, **Technicals**, and **Fundamentals** sub-tabs. You usually reach it by clicking a row anywhere in the dashboard. See [Ticker Detail](/dashboard/ticker-detail).
* **Top Movers**: the session's biggest movers, with each row's Phase shown alongside. See [Top Movers](/dashboard/top-movers).
* **Anomalies**: tickers flagged for unusual behavior outside the canonical setup (for example, a volume climax or a gap extreme). See [Anomalies](/dashboard/anomalies).
* **Overview**: a market-wide summary view. (This is different from the **Overview** sub-tab *inside* a Ticker Detail page, which is about that one ticker; see "How to read a ticker" below.)
* **Settings**: your notification preferences and data controls (export or delete your data). The theme toggle lives in the top bar, and the chart provider is chosen on a ticker's detail page, not here. See [Account & settings](/account-and-settings).
On a narrow phone, the **Alerts** tab moves into the menu so the top bar stays tidy. The views are the same; only where you tap to reach them changes, so your screen may not match a screenshot exactly.
## How to read a ticker
Open any ticker (click its row) to see its full context. Every part is descriptive, meant to help you review the situation before doing your own research:
* **Phase** describes the current state of the setup: **Coiling** (tightening base), **Pre-Ignition** (conditions starting to show), **Liftoff** (the most active phase, where the most conditions line up in the data at once), or **Below** (not in an active setup right now).
* **Conviction** groups how the ticker ranks against the rest of the market that session: **Low**, **Medium**, or **High**. On the detail page it appears as **Conviction NN/100**; in tables it sits under the **Conviction** column (shortened to **Conf** in the Advanced Filters drawer table and the Anomalies table). It's a separate axis from Phase: a Coiling ticker can be High Conviction, and a Liftoff ticker can be Low.
* **Risk flags** identify conditions worth a closer look, for example, **Extended** (already far from its base), **Elevated VIX**, **Bearish Market Regime**, or **Pre-Earnings Run** (an earnings event is near). They add context; they don't change the underlying number.
* **Chart and levels** show technical reference points (such as the pivot the setup is built around) as context, not as entry or exit instructions. The candlestick chart is the one live element on the page.
The three sub-tabs organize the rest: **Overview** (the summary for that ticker), **Technicals** (the price and volume behavior behind the Phase), and **Fundamentals** (company financials).
## Limits & common mistakes
* **Two "Overview" views exist.** The **Overview** in the menu is a market-wide summary; the **Overview** sub-tab inside Ticker Detail is about one ticker. Check which one you're on.
* **The board is end-of-day.** Only the ticker's candlestick chart is live; everything else reflects the last completed session.
* **A view organizes data; it doesn't recommend action.** Tabs, chips, and flags surface context for your own research.
## Next steps
Filters, chips, and the Advanced Filters drawer in depth.
What each phase means and why Conviction is relative.
Everything on a single ticker's page, sub-tab by sub-tab.