> ## Documentation Index
> Fetch the complete documentation index at: https://docs.speedsignal.com/llms.txt
> Use this file to discover all available pages before exploring further.
# Anomalies
> A risk-and-opportunity lens over the daily scan: seven flags that highlight tickers behaving unusually versus the rest of the market. Flags are informational context and never change a ticker's score.
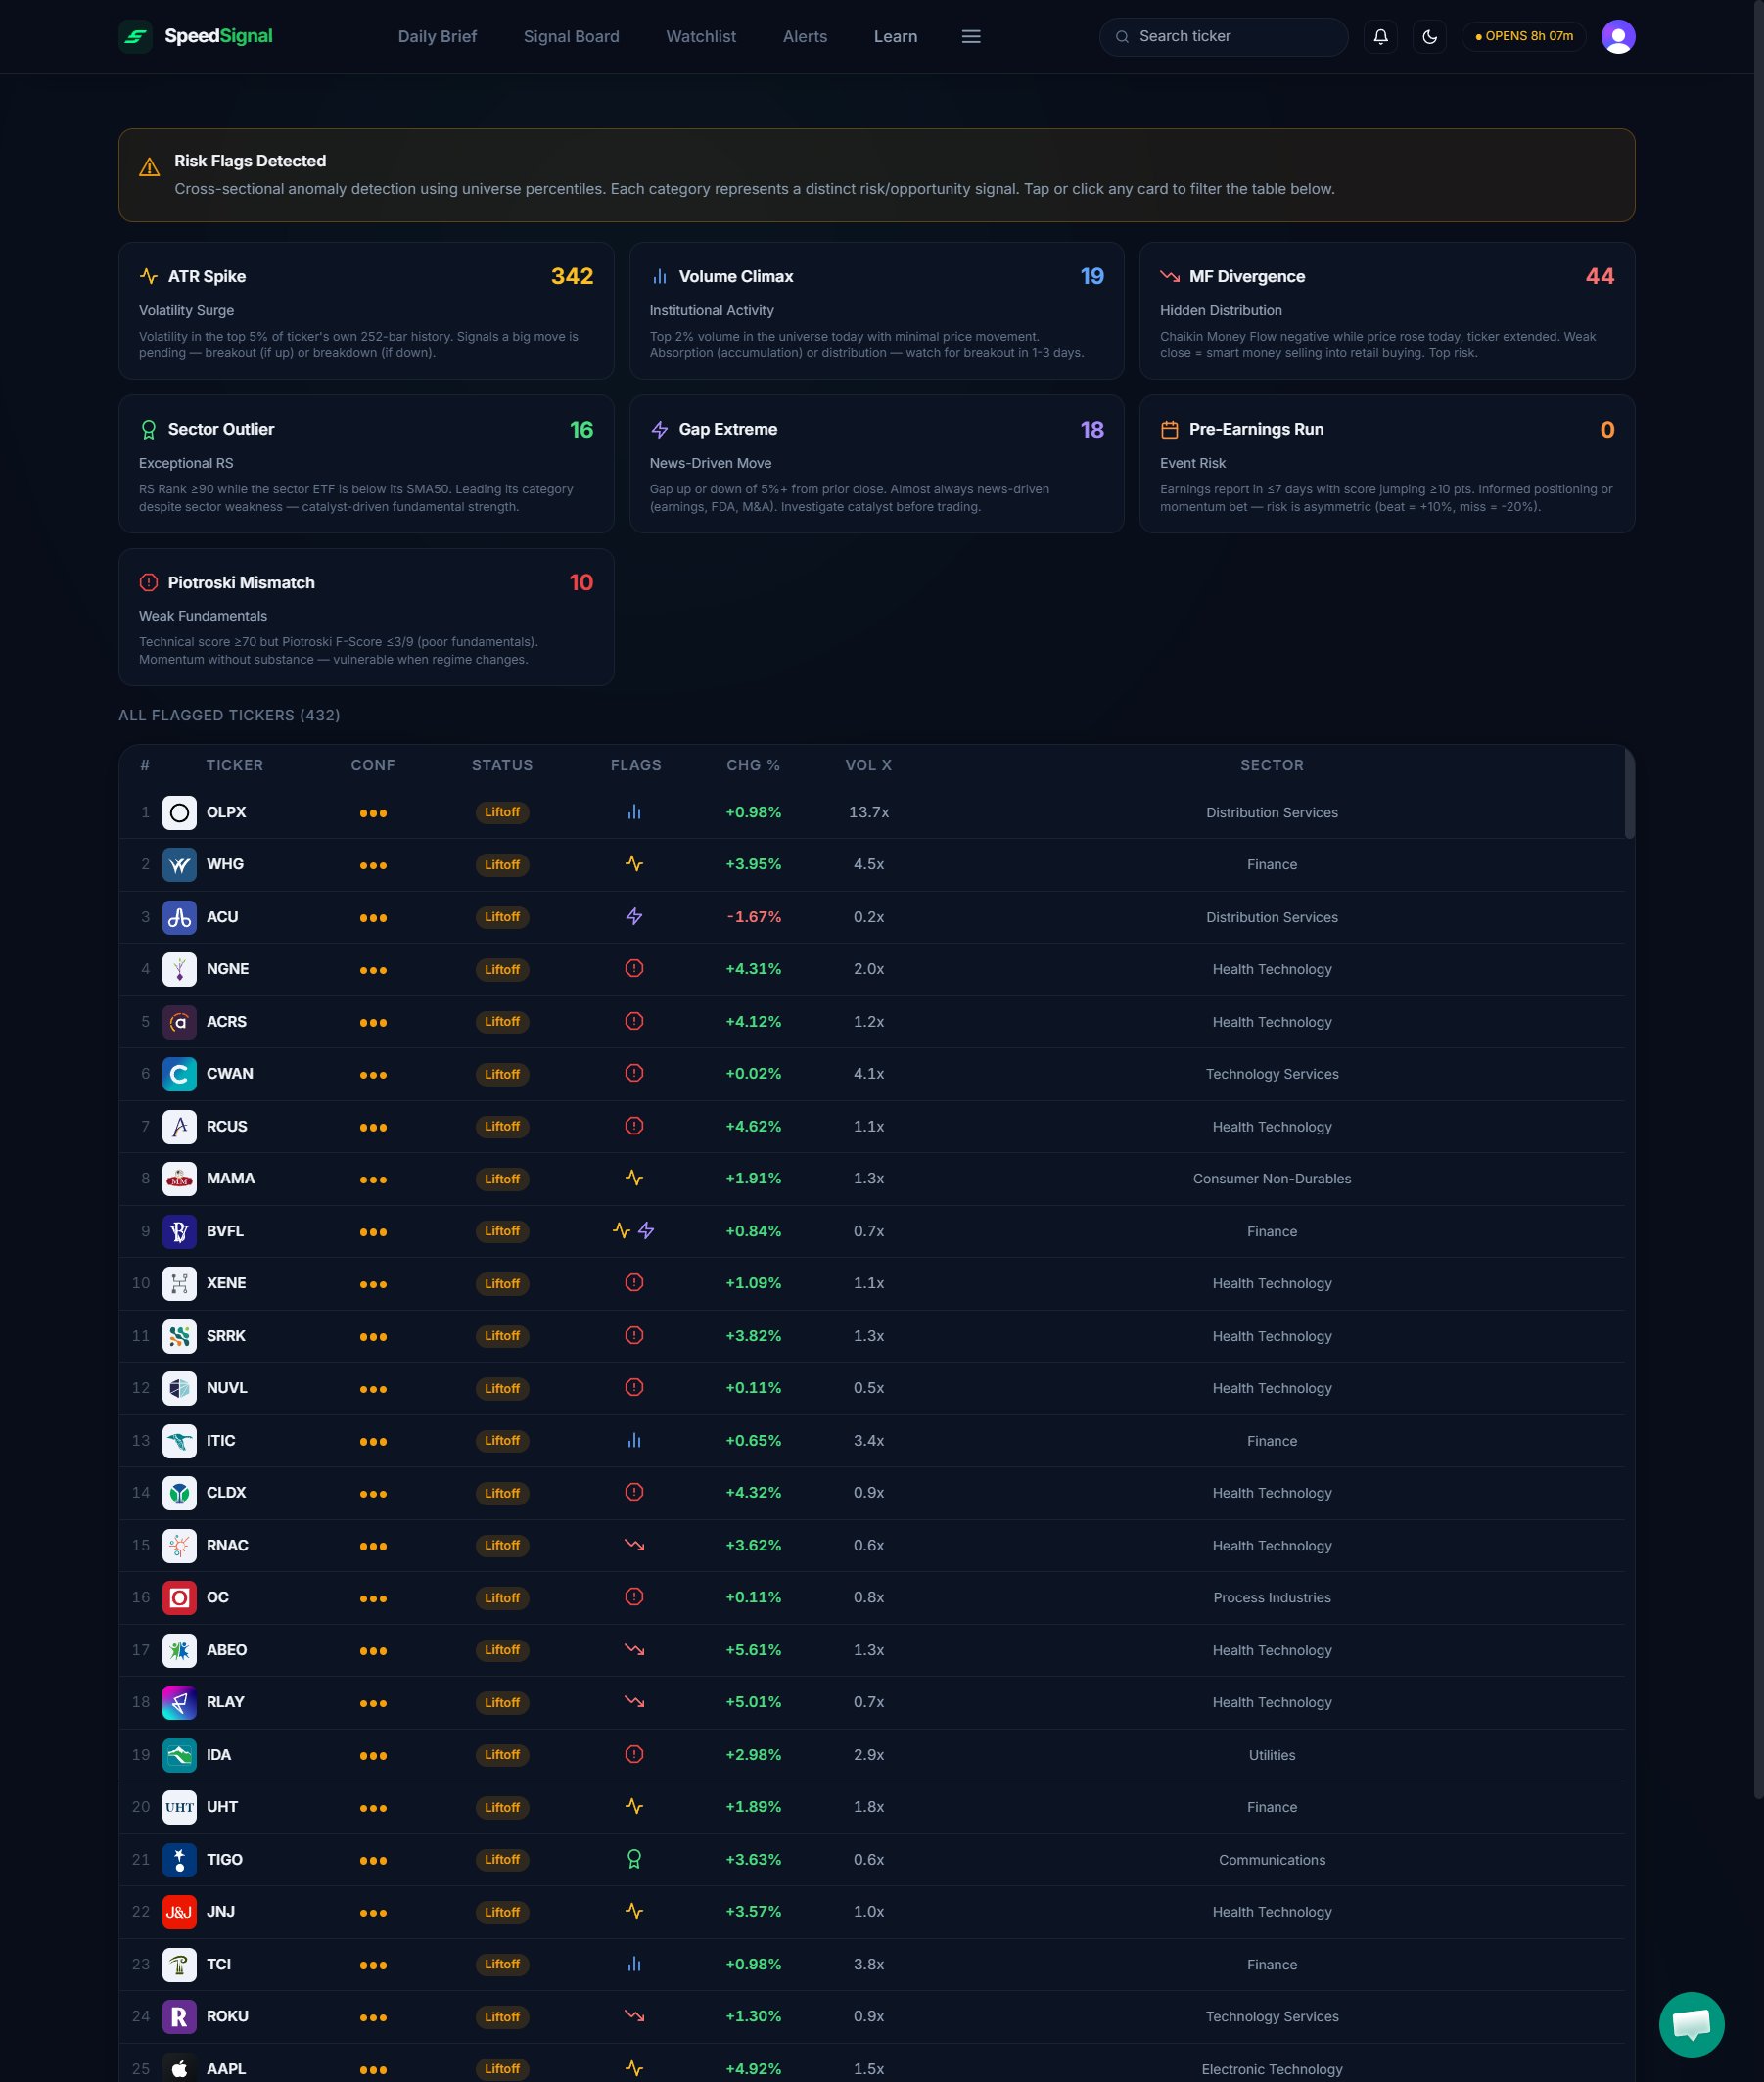
The **Anomalies** tab surfaces tickers whose behavior stands out from the rest of the day's scan. It compares each name against the whole universe and flags the ones sitting at the extremes, whether that is a risk worth knowing or an unusual strength worth a look.
Speed Signal AI is screening and analytics software, not a broker-dealer or investment adviser. Scores, phases, and screening results are data outputs and research candidates, not investment advice, recommendations, trading signals, or a buy list. Always do your own research.
Every flag here is **informational context**. Flags do **not** change a ticker's phase or Conviction; they sit alongside the score to tell you something extra about the name.
## What you see
At the top, a "Risk Flags Detected" banner explains the tab. Below it, seven flag cards each show a live count of how many tickers tripped that flag today. Under the cards, a table lists every flagged ticker with its Conviction level (the **Conf** column), its status, the specific flags it carries, and its sector.
 ## The seven flags
| Flag | What it highlights |
| ---------------------- | ------------------------------------------------------------------------------------------------------ |
| **ATR Spike** | Volatility has jumped into the top of the ticker's own recent range, so a larger move may be building. |
| **Volume Climax** | Unusually heavy volume paired with little price movement, which can mark absorption at a level. |
| **MF Divergence** | Money flow turned negative while the price rose, a weaker reading than the price alone suggests. |
| **Sector Outlier** | The ticker is leading its sector even while the sector itself is weak. |
| **Gap Extreme** | A large gap up or down from the prior close, almost always driven by news. |
| **Pre-Earnings Run** | An earnings report is due within about a week and the name has recently jumped (event risk). |
| **Piotroski Mismatch** | A strong technical reading paired with weak fundamentals. |
A single ticker can carry more than one flag at once. Some flags lean toward risk and some toward opportunity; the tab groups them together so you can see both.
## Filter by a flag
Click or tap any of the seven cards to filter the table below to only the tickers carrying that flag.
Tap the same card again, or use **Show All**, to return to the full list of flagged tickers.
## How to read the results
* **Flags are context, not a score.** A flag never raises or lowers a ticker's Conviction; it is a separate note about the name.
* **Counts change daily.** The number on each card is how many tickers tripped that flag in the latest scan, so it moves session to session.
* **Some days are clean.** When no ticker trips any flag, the tab shows a "No anomalies detected" state, meaning the universe looks clean across all seven categories.
* **A flag is a prompt to look, not a verdict.** For example, a Pre-Earnings Run marks event risk to be aware of; it does not tell you to act.
## Limits and common mistakes
* **Flags do not move the phase or Conviction.** If you are ranking names, use the phase and Conviction; treat flags as side context.
* **Everything here is end-of-day.** The tab reflects the most recent completed session, not live intraday behavior.
* **"Anomaly" is one of the risk flags elsewhere too.** A name flagged here may also show an anomaly note on its [detail page](/dashboard/ticker-detail).
## Next steps
Open a flagged name to see its full context and readings.
Filter the full scan by phase and market cap.
The three pillars behind every phase and Conviction level.
## The seven flags
| Flag | What it highlights |
| ---------------------- | ------------------------------------------------------------------------------------------------------ |
| **ATR Spike** | Volatility has jumped into the top of the ticker's own recent range, so a larger move may be building. |
| **Volume Climax** | Unusually heavy volume paired with little price movement, which can mark absorption at a level. |
| **MF Divergence** | Money flow turned negative while the price rose, a weaker reading than the price alone suggests. |
| **Sector Outlier** | The ticker is leading its sector even while the sector itself is weak. |
| **Gap Extreme** | A large gap up or down from the prior close, almost always driven by news. |
| **Pre-Earnings Run** | An earnings report is due within about a week and the name has recently jumped (event risk). |
| **Piotroski Mismatch** | A strong technical reading paired with weak fundamentals. |
A single ticker can carry more than one flag at once. Some flags lean toward risk and some toward opportunity; the tab groups them together so you can see both.
## Filter by a flag
Click or tap any of the seven cards to filter the table below to only the tickers carrying that flag.
Tap the same card again, or use **Show All**, to return to the full list of flagged tickers.
## How to read the results
* **Flags are context, not a score.** A flag never raises or lowers a ticker's Conviction; it is a separate note about the name.
* **Counts change daily.** The number on each card is how many tickers tripped that flag in the latest scan, so it moves session to session.
* **Some days are clean.** When no ticker trips any flag, the tab shows a "No anomalies detected" state, meaning the universe looks clean across all seven categories.
* **A flag is a prompt to look, not a verdict.** For example, a Pre-Earnings Run marks event risk to be aware of; it does not tell you to act.
## Limits and common mistakes
* **Flags do not move the phase or Conviction.** If you are ranking names, use the phase and Conviction; treat flags as side context.
* **Everything here is end-of-day.** The tab reflects the most recent completed session, not live intraday behavior.
* **"Anomaly" is one of the risk flags elsewhere too.** A name flagged here may also show an anomaly note on its [detail page](/dashboard/ticker-detail).
## Next steps
Open a flagged name to see its full context and readings.
Filter the full scan by phase and market cap.
The three pillars behind every phase and Conviction level.