> ## Documentation Index
> Fetch the complete documentation index at: https://docs.speedsignal.com/llms.txt
> Use this file to discover all available pages before exploring further.
# Ticker detail
> The full context for one ticker: its Phase, Conviction NN/100, risk flags, technical and fundamental readings, and a live candlestick chart, organized across Overview, Technicals, and Fundamentals sub-tabs.
Open any ticker to see everything the system knows about it in one place: where it sits in its setup, how it ranks today, the conditions behind that, and a chart. Each part is descriptive context to help you review the name before doing your own research.
Speed Signal AI is screening and analytics software, not a broker-dealer or investment adviser. Scores, phases, and screening results are data outputs and research candidates, not investment advice, recommendations, trading signals, or a buy list. Always do your own research.
## What you see
The detail page leads with the ticker's **Phase** badge and its **Conviction** number, shown as **Conviction NN/100** with a level (Low, Medium, or High). Below the header, a candlestick **chart** and three sub-tabs, **Overview**, **Technicals**, and **Fundamentals**, hold the rest of the context.
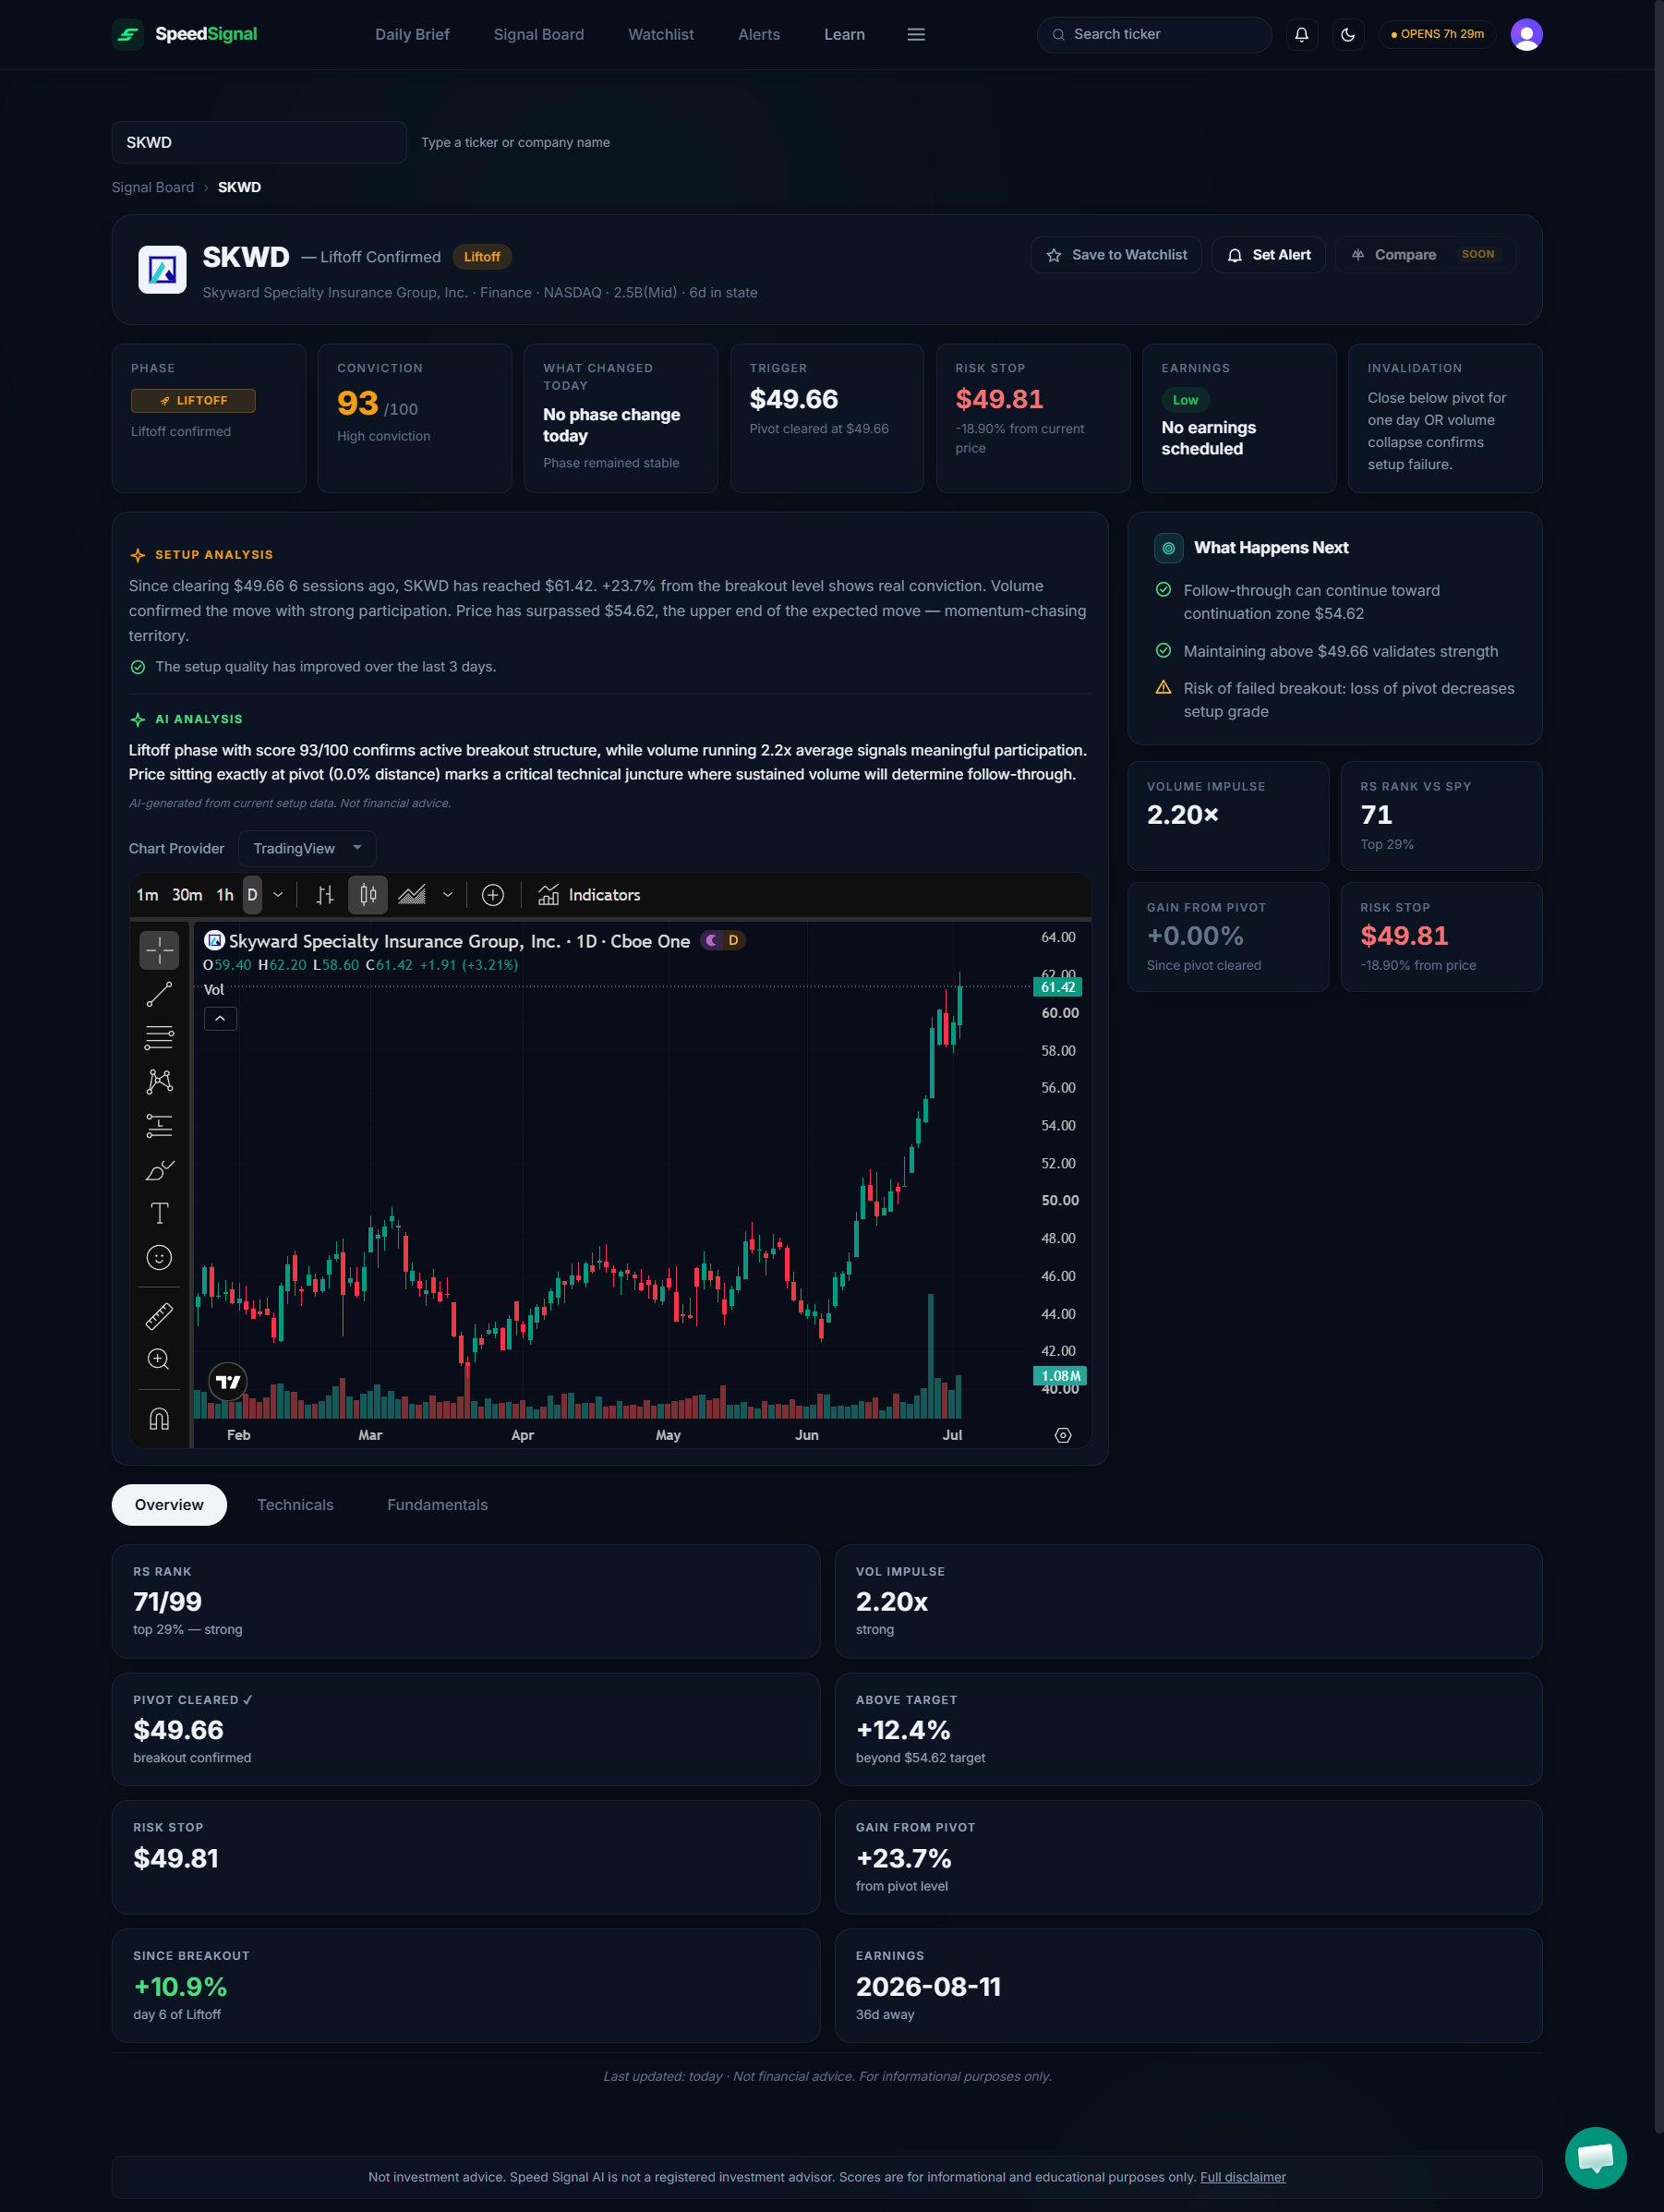 This **Overview** is the ticker's own sub-tab. It is not the same as the dashboard-level **Overview** tab in the menu, which summarizes the whole market. On a ticker page, "Overview" always means this one ticker.
## The three sub-tabs
* **Overview** is a compact snapshot: the ticker's relative-strength rank, its volume impulse, the pivot the setup is built around, a reference breakout range derived from that pivot, its earnings date, and the risk reference levels the methodology tracks. These are context, not entry or exit instructions.
* **Technicals** shows the readings behind the phase, grouped into cards: volatility and squeeze, relative strength, money flow and accumulation, price structure, and returns with the RS Rank.
* **Fundamentals** shows quarterly company data: earnings and valuation, margins and returns, analyst estimates, and quarter-over-quarter acceleration.
## Reference levels, not instructions
A few cards on a ticker page carry labels that look like trade parameters: **Risk Stop**, **Invalidation**, **Breakout Range**, **Price Target**, and **R:R Ratio**. In Speed Signal AI these are **methodology reference points**, computed the same way for every ticker so you can compare setups on a common footing. They describe the geometry of the pattern the model tracks. They are **not** stop-loss orders, price forecasts, entry or exit signals, position-sizing guidance, or a recommendation to act.
* **Breakout Range** is a reference band derived from the pivot, not a prediction that price will get there.
* **Risk Stop** and **Invalidation** mark where the tracked pattern would no longer hold, shown for context, not as an instruction to place an order.
* **Price Target** reflects the average external analyst target for the name, shown as reference data, not our own forecast or advice.
* **R:R Ratio** is a descriptive ratio between those reference levels, not a judgment that a trade is worthwhile.
Speed Signal AI is screening and analytics software, not a broker-dealer or investment adviser. Scores, phases, and screening results are data outputs and research candidates, not investment advice, recommendations, trading signals, or a buy list. Always do your own research.
## How to read a ticker page
Read the pieces together, top to bottom:
* **Phase** describes the current state of the setup (Coiling, Pre-Ignition, Liftoff, or Below). It is a description, not an instruction.
* **Conviction NN/100** summarizes how many tracked conditions are present, and the **level** (Low / Medium / High) reflects how that number ranks against the rest of the market that same session.
* **Risk flags** identify conditions worth a closer look, for example a name that has already run far from its base, one with earnings coming up, or one carrying an [anomaly flag](/dashboard/anomalies).
* **The chart and levels** show technical reference points (such as the pivot) as context for your own analysis, not as targets to act on.
The candlestick chart is the **only live element** in the product; everything else on the page reflects the most recent completed session. Use the **Chart Provider** control above the chart to change how it renders; see [Account & settings](/account-and-settings).
## Limits and common mistakes
* **Two Overviews.** The sub-tab here is about one ticker; the menu's Overview tab is about the whole market. Do not confuse them.
* **Almost everything is end-of-day.** Only the chart updates live. The Phase, Conviction, and readings reflect the last completed session.
* **Conviction is relative and resets daily.** A high number today does not mean the ticker is objectively good or recommended; it means it ranked near the top of that day's scan of 3,000+ names. See [Phases and Conviction](/scores/phases-and-conviction).
* **Levels are context, not calls.** The pivot and reference levels describe the setup; they are not a recommendation to enter, exit, or size a position.
* **Some fundamentals are sparse.** Coverage varies by ticker, so a few Fundamentals fields may be blank.
## Next steps
What the Phase badge and Conviction NN/100 actually mean.
The risk flags a ticker can carry, and what each one means.
Save this ticker to track how it is classified over time.
This **Overview** is the ticker's own sub-tab. It is not the same as the dashboard-level **Overview** tab in the menu, which summarizes the whole market. On a ticker page, "Overview" always means this one ticker.
## The three sub-tabs
* **Overview** is a compact snapshot: the ticker's relative-strength rank, its volume impulse, the pivot the setup is built around, a reference breakout range derived from that pivot, its earnings date, and the risk reference levels the methodology tracks. These are context, not entry or exit instructions.
* **Technicals** shows the readings behind the phase, grouped into cards: volatility and squeeze, relative strength, money flow and accumulation, price structure, and returns with the RS Rank.
* **Fundamentals** shows quarterly company data: earnings and valuation, margins and returns, analyst estimates, and quarter-over-quarter acceleration.
## Reference levels, not instructions
A few cards on a ticker page carry labels that look like trade parameters: **Risk Stop**, **Invalidation**, **Breakout Range**, **Price Target**, and **R:R Ratio**. In Speed Signal AI these are **methodology reference points**, computed the same way for every ticker so you can compare setups on a common footing. They describe the geometry of the pattern the model tracks. They are **not** stop-loss orders, price forecasts, entry or exit signals, position-sizing guidance, or a recommendation to act.
* **Breakout Range** is a reference band derived from the pivot, not a prediction that price will get there.
* **Risk Stop** and **Invalidation** mark where the tracked pattern would no longer hold, shown for context, not as an instruction to place an order.
* **Price Target** reflects the average external analyst target for the name, shown as reference data, not our own forecast or advice.
* **R:R Ratio** is a descriptive ratio between those reference levels, not a judgment that a trade is worthwhile.
Speed Signal AI is screening and analytics software, not a broker-dealer or investment adviser. Scores, phases, and screening results are data outputs and research candidates, not investment advice, recommendations, trading signals, or a buy list. Always do your own research.
## How to read a ticker page
Read the pieces together, top to bottom:
* **Phase** describes the current state of the setup (Coiling, Pre-Ignition, Liftoff, or Below). It is a description, not an instruction.
* **Conviction NN/100** summarizes how many tracked conditions are present, and the **level** (Low / Medium / High) reflects how that number ranks against the rest of the market that same session.
* **Risk flags** identify conditions worth a closer look, for example a name that has already run far from its base, one with earnings coming up, or one carrying an [anomaly flag](/dashboard/anomalies).
* **The chart and levels** show technical reference points (such as the pivot) as context for your own analysis, not as targets to act on.
The candlestick chart is the **only live element** in the product; everything else on the page reflects the most recent completed session. Use the **Chart Provider** control above the chart to change how it renders; see [Account & settings](/account-and-settings).
## Limits and common mistakes
* **Two Overviews.** The sub-tab here is about one ticker; the menu's Overview tab is about the whole market. Do not confuse them.
* **Almost everything is end-of-day.** Only the chart updates live. The Phase, Conviction, and readings reflect the last completed session.
* **Conviction is relative and resets daily.** A high number today does not mean the ticker is objectively good or recommended; it means it ranked near the top of that day's scan of 3,000+ names. See [Phases and Conviction](/scores/phases-and-conviction).
* **Levels are context, not calls.** The pivot and reference levels describe the setup; they are not a recommendation to enter, exit, or size a position.
* **Some fundamentals are sparse.** Coverage varies by ticker, so a few Fundamentals fields may be blank.
## Next steps
What the Phase badge and Conviction NN/100 actually mean.
The risk flags a ticker can carry, and what each one means.
Save this ticker to track how it is classified over time.