

Speed Signal AI is screening and analytics software, not a broker-dealer or investment adviser. Scores, phases, and screening results are data outputs and research candidates, not investment advice, recommendations, trading signals, or a buy list. Always do your own research.
What you see
The detail page shows the ticker’s Phase, a Conviction label (Low, Medium, or High), and a Score from 0 to 100. The Score number stays neutral; its bar uses the same Conviction band color as the tables. Setup Quality is no longer displayed. The price chart, setup summary, Technicals, and Fundamentals provide the rest of the context. Opening a ticker starts at its company information and price, even if you were far down the previous view. This also applies when you select the same ticker again or use Open in Compare. Updates to a ticker already open preserve your reading position, selected data tab, and open explanation instead of returning you to the header. The compact metric strip contains Score, Market Cap, RS Rank, and Earnings Risk. Select the information icon beside any title for a plain-language explanation and the current value when available. RS Rank keeps its Pro access limit. Earnings Risk describes how close the scheduled earnings report is, not the total risk of the stock. Pivot and Penalties are no longer shown in this strip; relevant reference levels remain elsewhere in the detail page.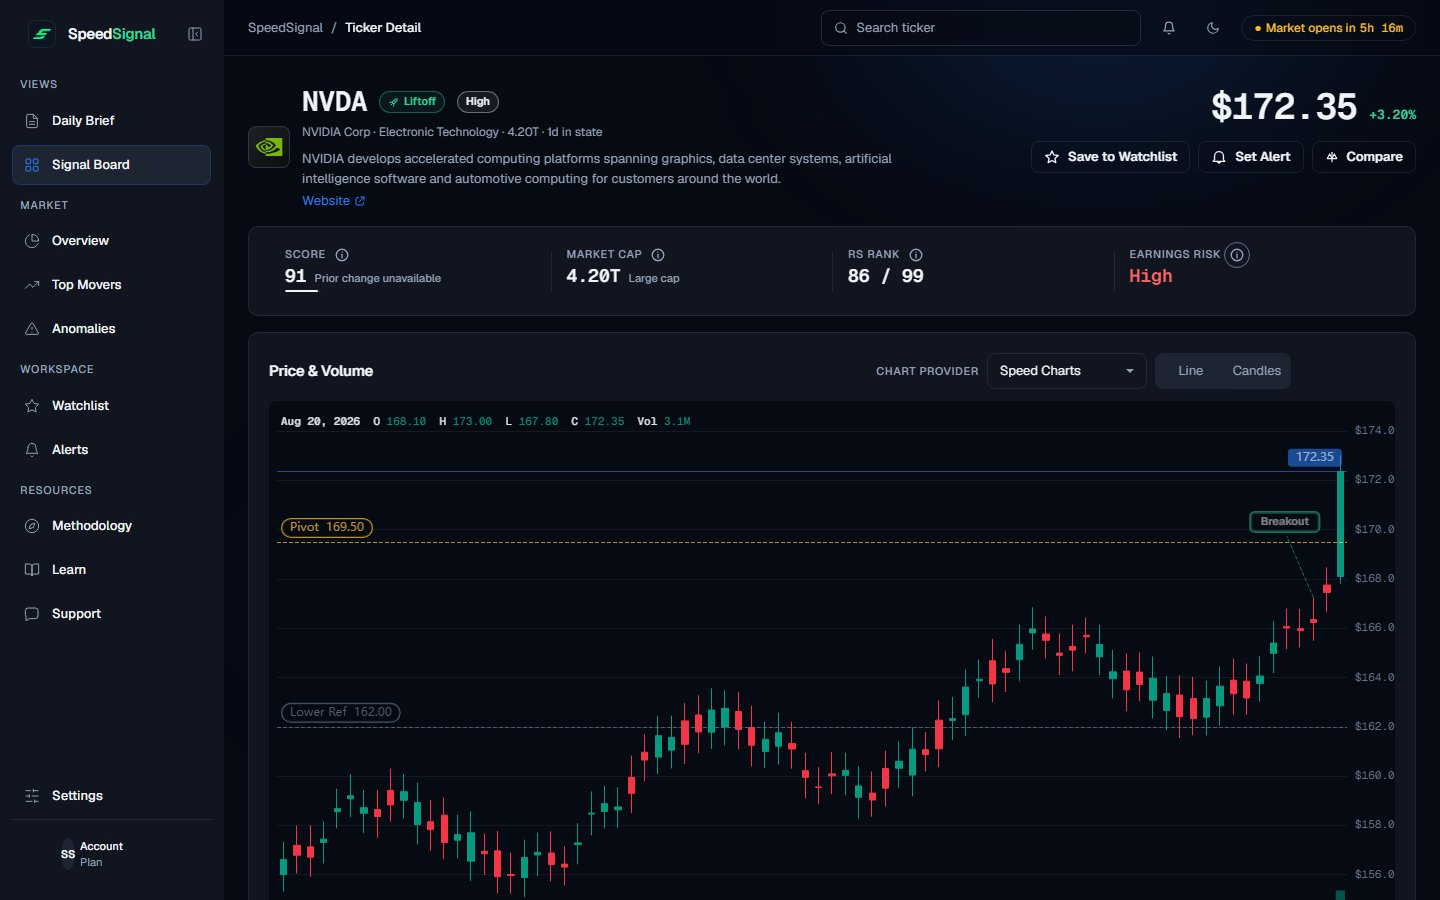
The screenshot uses simulated data to illustrate the interface.
Overview in the main menu describes the whole market. Ticker Detail describes one ticker; its data tabs are Technicals and Fundamentals.
Compare setups
Compare opens a side-by-side view with Phase, Score, Change today, Volume ×, RS Rank, Sessions active, Sector, Market cap, Close, % Chg, and Earnings risk. Change today combines the score change with a phase transition when one occurred. RS Rank is available with Pro. The comparison no longer repeats Conviction, Setup Quality, Pivot, or distance to pivot as rows. The two company logos fill their header frames without extra inset padding. Their proportions are preserved, and a missing logo uses the existing fallback.The two data tabs
- Technicals arranges 42 readings in five groups: Price Structure, Squeeze & Volatility, Relative Strength, Money Flow & Accumulation, and Returns & RS Rank.
- Fundamentals arranges 22 company readings in three groups: Quarterly Acceleration, Earnings & Valuation, and Margins & Returns.
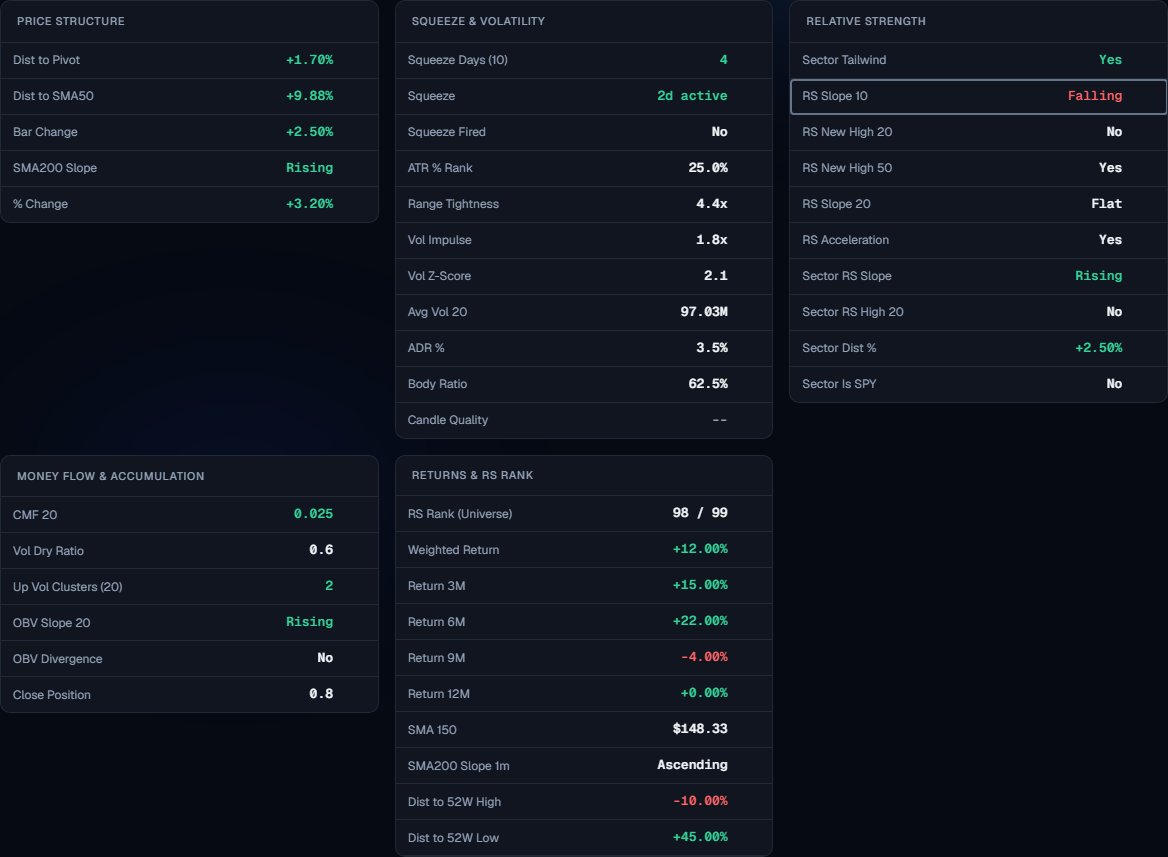
Free and Pro. The header, the chart, the rule-based analysis, and the setup summary are available for any ticker on every plan (RS Rank and Since pivot break keep their Pro locks). The full Technicals and Fundamentals panels are a Pro feature.
Reference levels, not instructions
The page shows a Pivot reference, Lower reference, and Upper reference when their data is available. They describe levels used in the screening context, not orders, price forecasts, or recommendations. Read them alongside the latest close and the conditions described on the page.Speed Signal AI is screening and analytics software, not a broker-dealer or investment adviser. Scores, phases, and screening results are data outputs and research candidates, not investment advice, recommendations, trading signals, or a buy list. Always do your own research.
How to read a ticker page
Read the pieces together, top to bottom:- Phase describes the current state of the setup (Coiling, Pre-Ignition, Liftoff, or Below). It is a description, not an instruction.
- Score is the numeric setup reading. Conviction is its relative Low, Medium, or High band, shown as a label rather than a duplicate number.
- Risk flags identify conditions worth a closer look, for example a name that has already run far from its base, one with earnings coming up, or one carrying an anomaly flag.
- The chart and levels show technical reference points (such as the pivot) as context for your own analysis, not as targets to act on.
Limits and common mistakes
- Almost everything is end-of-day. The Phase, Score, Conviction label, and readings reflect the last completed session.
- Conviction is relative and resets daily. A High label today does not mean the ticker is objectively good or recommended; it means it ranked near the top of that day’s scan of 3,000+ names. See Phases and Conviction.
- Levels are context, not calls. The pivot and reference levels describe the setup; they are not a recommendation to enter, exit, or size a position.
- Some fundamentals are sparse. Coverage varies by ticker, so a few Fundamentals fields may be blank.
Next steps
Phases and Conviction
What Phase, Score, and the Conviction label mean.
Anomalies
The risk flags a ticker can carry, and what each one means.
Watchlist
Save this ticker to track how it is classified over time.