

Speed Signal AI is screening and analytics software, not a broker-dealer or investment adviser. Scores, phases, and screening results are data outputs and research candidates, not investment advice, recommendations, trading signals, or a buy list. Always do your own research.
Scores update once per day, after the US market closes. Everything you see reflects the most recent completed trading session, not live intraday prices. The only live element is the candlestick chart on a ticker’s detail page.
What you see
The dashboard opens on the Daily Brief, a summary of what changed in the latest scan. From the top navigation you can move to the Signal Board, Watchlist, and Alerts.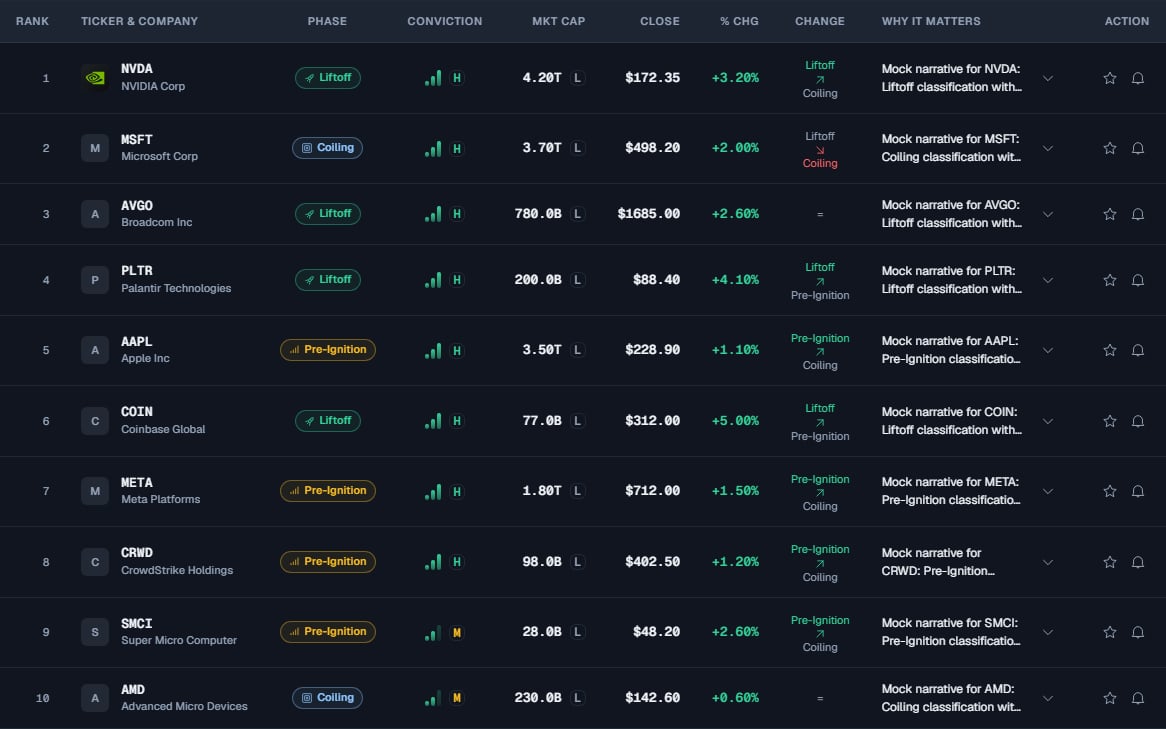
Get your first win
1
Sign in
Go to app.speedsignal.com and sign in with your email address or a social account. On your first visit you’ll create an account on the Free plan, so you can start without a card.
2
Open the Daily Brief
The Daily Brief is the home view and opens by default. It answers “what changed today?” at a glance: a Market Snapshot (an overall regime card plus four KPI cards, New Liftoffs, Pre-Ignition Upgrades, Near Pivot, and Failed Setups), the Top 10 Daily Setups table, and a Sector Strength panel. Click a KPI card to open the Signal Board filtered to those names.
3
Read a ticker's Phase and Conviction
Every ticker carries a Phase badge (Coiling, Pre-Ignition, Liftoff, or Below) that describes the current state of its setup. Next to it, the Conviction column shows a level: Low, Medium, or High. These are the two things to read first: Phase tells you what stage the setup is in, Conviction tells you how it ranks today.
4
Narrow the Signal Board to a shortlist
Open the Signal Board (the full, filterable screener). Use the quick-filter chips to narrow the list to what you want to review. For example, tap New Liftoffs to see names that just reached the Liftoff phase, or Highest Conviction to see the day’s highest-Conviction names. You can also search for a ticker, or open Advanced Filters for finer control (Conviction, status, tier, and risk-flag pills, plus the eligibility thresholds). What’s left is a shortlist to research on your own.
5
Open a ticker for its chart and context
Click any row to open its preview panel (a side panel on desktop, a bottom sheet on mobile) with the ticker’s key context at a glance. From there, View Full Analysis opens the full Ticker Detail page: a candlestick chart plus Technicals and Fundamentals tabs, the Phase badge, the Score and its Conviction label, any risk flags, and the technical reference levels the setup is built around.
6
Save it to your Watchlist
Tap the star icon next to a ticker to save it to your Watchlist. Your Watchlist starts empty; saved names let you track phase changes and Conviction over time without hunting for them each day.
7
Optional: create an alert
Open Alerts and turn on a preset (for example, Phase Upgrade or Liftoff Confirmation) or build a custom per-ticker rule. Your delivery channels (email, push, or in-app) are chosen once in Settings, not per alert, and Speed Signal AI notifies you when that condition shows up, so you don’t have to check manually. (Quiet hours are respected.)
How to read what you see
Lead with the two things on screen for every ticker:- Phase is a description of a state, not an instruction. “Liftoff” means the setup conditions are most aligned in the data right now, not that you should act.
- Conviction is a separate axis from Phase. A Coiling ticker can be High Conviction, and a Liftoff ticker can be Low Conviction. On a ticker’s detail page, Score is the number and Conviction is the label.
Limits & common mistakes
Next steps
Dashboard tour
A map of every view and how to read a ticker at a glance.
Phases & Conviction
What each phase means and why Conviction is relative.
Signal Board
Filters, chips, and the Advanced Filters drawer in depth.