

Speed Signal AI is screening and analytics software, not a broker-dealer or investment adviser. Scores, phases, and screening results are data outputs and research candidates, not investment advice, recommendations, trading signals, or a buy list. Always do your own research.
What you see
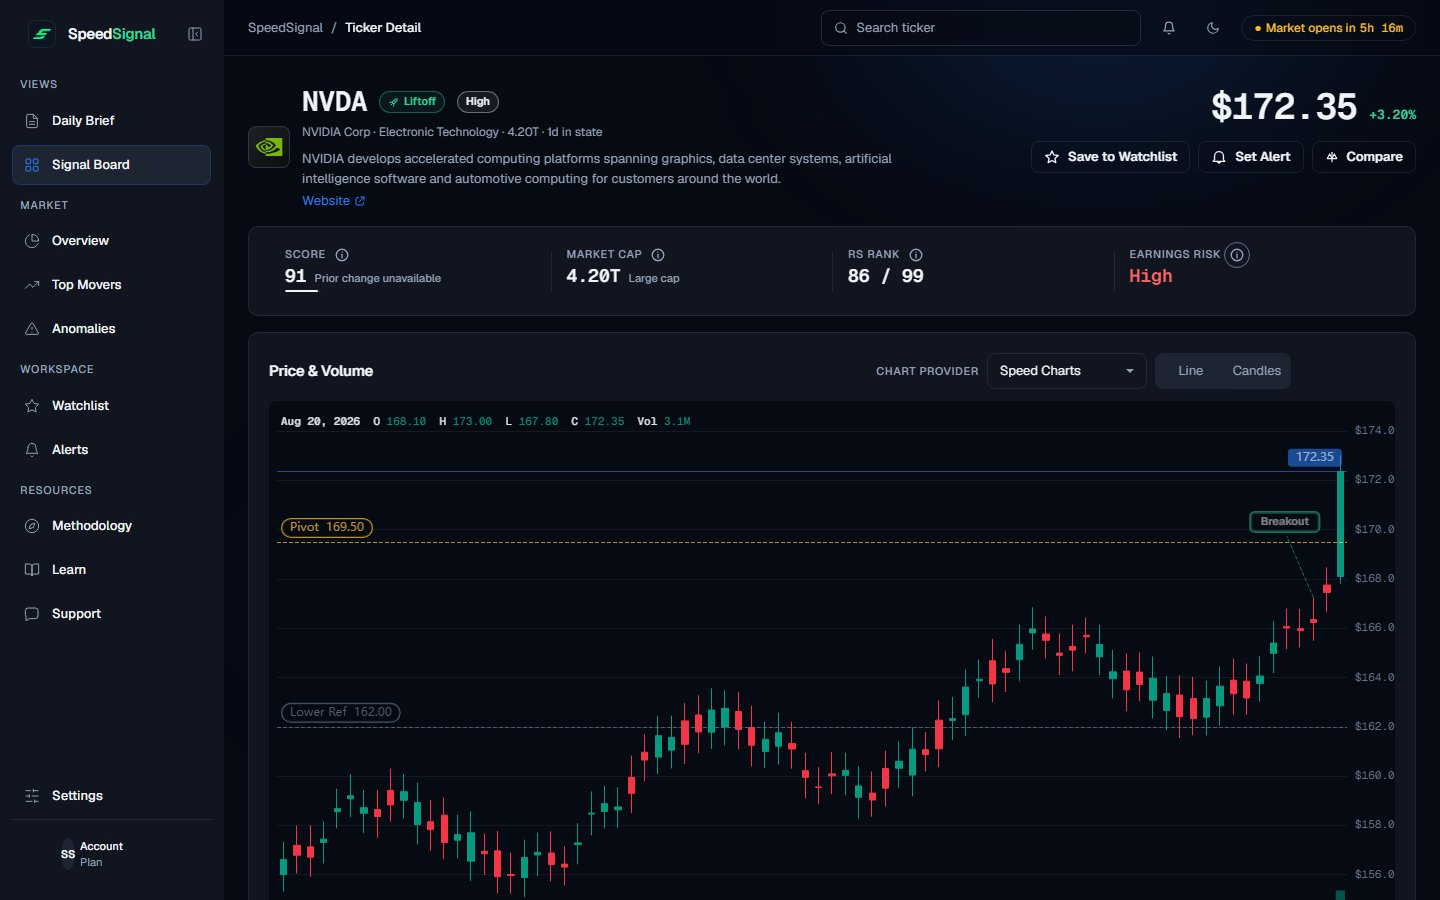
The screenshot uses simulated data to illustrate the interface.
- On a ticker’s detail page, Score is the number; Conviction is the Low, Medium, or High label.
- In tables, Score is shown once, with a bar. The number stays neutral; the bar color indicates the Conviction band; there is no separate numeric Conviction column.
- Every row also carries a Phase badge (Coiling, Pre-Ignition, Liftoff, or Below), which is a separate label. See Phases & Conviction.
How the number is built
The model evaluates each ticker across three pillars. Each pillar is scored 0–100 based on how many of its conditions are present, and the three combine into the single 0–100 number (their average).Pillar 1: Base “Stealth Coil”
Describes how orderly and compressed a stock’s recent trading behavior is:- Volatility Contraction: how much the day-to-day price swings have tightened versus the stock’s own recent history.
- Tightness: how narrow and controlled the recent trading action is.
- Squeeze Detection: whether recent volatility compression is notable enough to support a tighter, more orderly setup classification.
- Trend Quality: whether the stock is trending up in an orderly way rather than downtrending or chopping sideways.
- Pivot Proximity: how close the stock is to a relevant technical reference area identified by the methodology.
Pillar 2: Accumulation “Demand Profile”
Surfaces price and volume behavior often associated with persistent participation:- Relative Strength: whether the stock is leading the broad market rather than lagging it.
- Money Flow: whether volume and price behavior fit sustained-participation patterns rather than a one-day spike.
- Volume Dry-Up: quiet volume while price holds tight, a pattern historically associated with reduced selling pressure.
- Sector Tailwind: whether the broader industry group is supportive rather than acting as a headwind.
Pillar 3: Ignition “Participation Expansion”
Measures whether current price and participation behavior is broadening versus the recent baseline:- Volume Impulse: whether trading activity is expanding materially versus the stock’s normal baseline.
- Early Ignition: whether price and participation are strengthening in the current data.
- Candle Quality: whether the session’s price action shows broad-participation characteristics rather than thin or one-sided trading.
Find a ticker’s Score
1
Open a ticker
From the Signal Board or Daily Brief, select any ticker to open its detail page.
2
Read the Score
The Score number and its Low / Medium / High level sit near the top of the page, alongside the Phase badge.
3
See the pillars behind it
Open the Technicals sub-tab to review the underlying measures that feed the three pillars.
How to read the number
- Higher means more conditions are lining up, not that a stock is “good” or that a move will happen. It is a summary of what the data is doing right now.
- The number and the level answer different questions. The 0–100 number measures how many conditions are present for that ticker. The Low/Medium/High level measures how that number ranks against the rest of the market that same day. A high number does not guarantee a High level, because the level depends on how everything else scored. See Phases & Conviction.
- It is reproducible. Given the same market data, the model produces the same number every time. There is no sentiment analysis or subjective judgment involved.
Limits & common mistakes
- Do not read the number as a prediction. It describes present conditions, not a forecast that a move will continue.
- Do not compare numbers across different days as if they were fixed grades. Scores update once per day and can shift with data revisions. See Data & coverage.
- A high number can still carry risk flags (for example, Extended or Pre-Earnings Run). Those do not change the number; they add context you should read alongside it.
Next steps
Phases & Conviction
How the four phases and the Low/Medium/High levels work, and why they are separate axes.
Data & coverage
Where the numbers come from, when they update, and which tickers are eligible.
Signal Board
Filter and compare tickers by phase, Conviction, and market cap.
Glossary
Plain-language definitions of every label you see in the app.